TFS On The Road v1.5 just published
Hi Folks,
The v1.5 of the TFS On The Road was just published to the Market Place. This new version holds the interesting feature that I showed on the post Improving TFS On The Road chart capabilities .
Basically this feature will allow you to drill down on your work items through different levels.
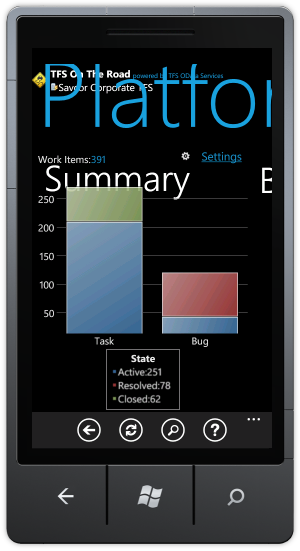
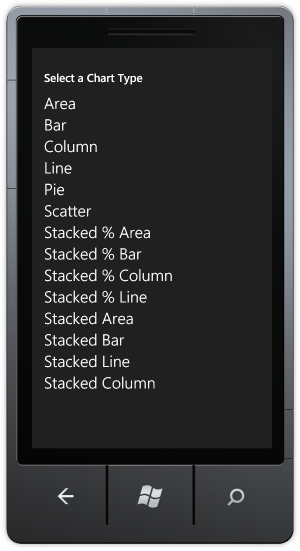
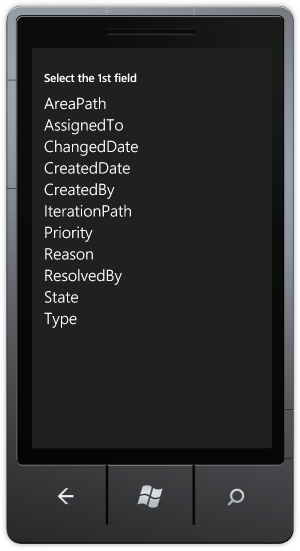
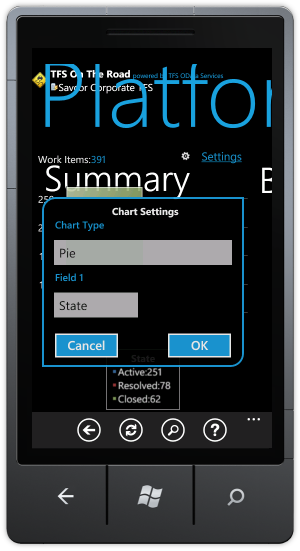
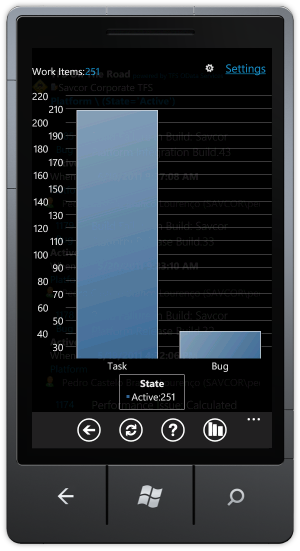
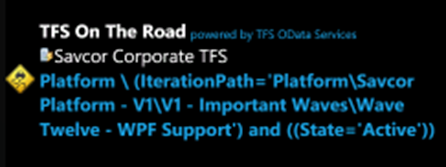
Let me show some pictures to explain better. Bellow you can see the stacked chart of WI types per State. Note that there’s a Settings Link up-right of the chart. When you click there you will see one screen to select some chart settings. You can select between a set of chart types. Stacked charts supports two fields.
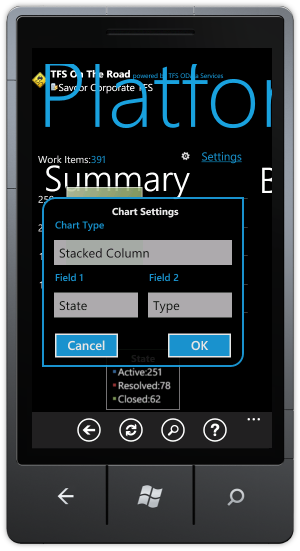
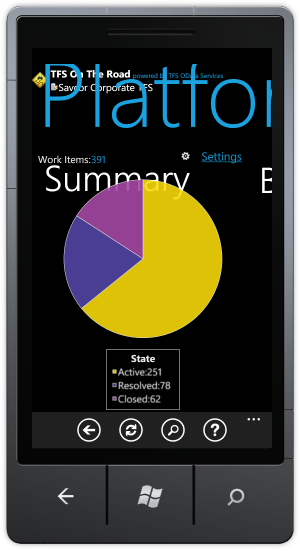
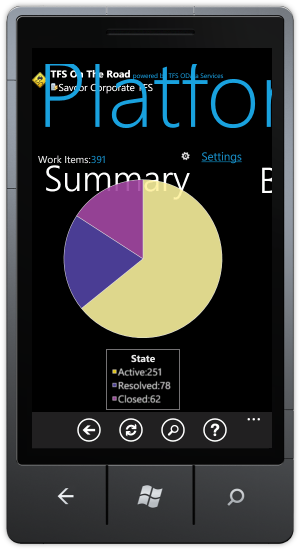
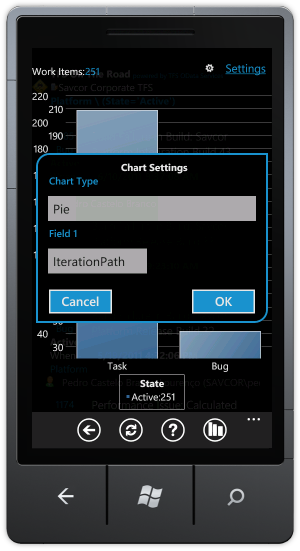
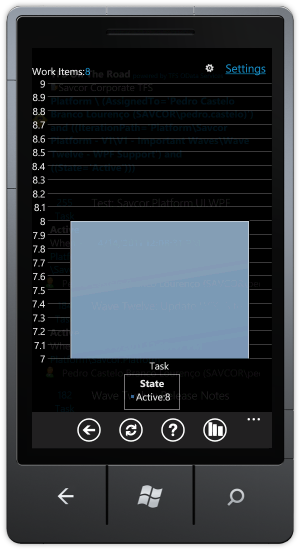
I will change it to show a pie chart of Work Item states on the project summary, as shown below. As soon as you click on the OK button the chart will be rendered and the settings will be saved for this level (1st level). On tis sample I will drill down to the Active work Items just taping the chart area…
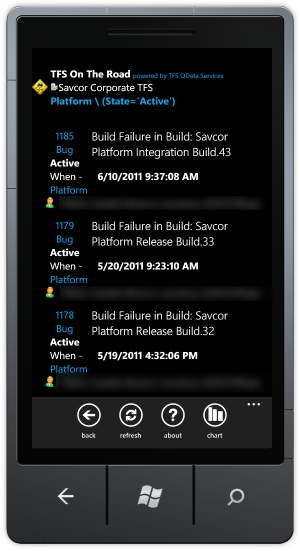
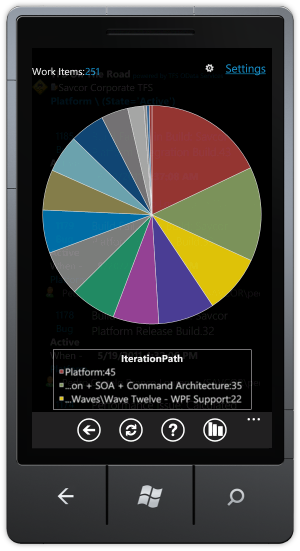
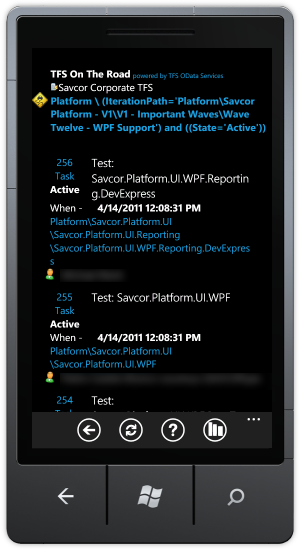
As soon as I do this I will see the list of work items filtered by state=’Active’. Note that you have the option to show a chart for this Work items list as well. Just tap the Chart button(bottom right). First you will see the default chart(stacked by WI type/State). This time I will change to Pie by Iteration Path. Then I can immediately see all Active Wi’s by Iteration Path! Awesome!
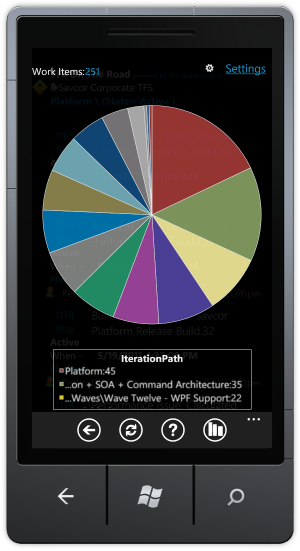
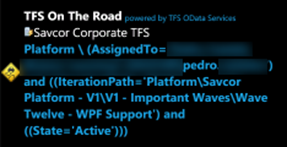
And I can always drill down! On the sample I will go to the Yellow Area of the char t(Wave Twelve…)… Then I will get to the work items list again! And if you note on the top part you will see the applied Filter…
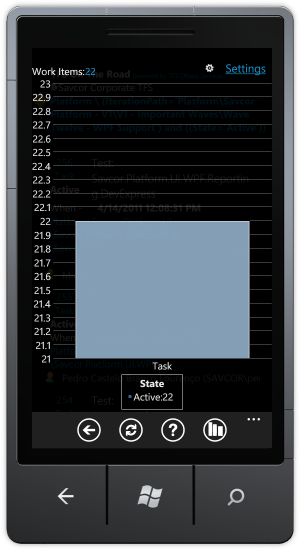
And you can take a look on the chart as well for this level (3rd level). It starts with the default chart… Of course you can change it as well. On the last level I Changed to show Bar charts by “Assigned to”.
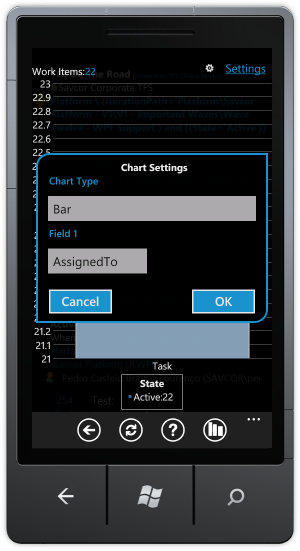
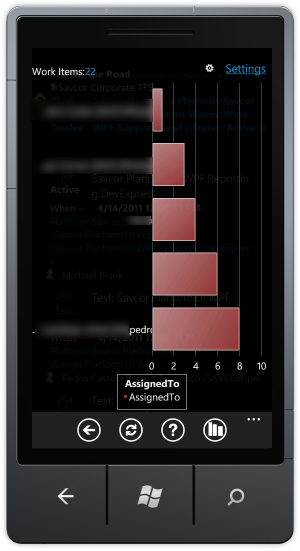
And Of Course I can move On!!!! I will click on the last bar to drill down again (pedro’s active tasks on the Iteration ‘Wave Twelve’)… Look the list and the applied Filter… And Of course you could drill down again! J But I think it’s deep enough on this sample. Theoretically you could drill down as much as you can.

Really nice, isn’t it? J As you could see, we navigate in 4 drill-down levels:
- Pie chart by WI States, selected the Active Work Items
- Then Pie Chart by Iteration Paths, we selected “Wave Twelve”
- Then we made a bar chart by “Assigned to”
- Finally we got to the last level on this sample
What is interesting is that every settings that you defined so far were saved per level! Next time you will not need to configure the chart(by tapping on settings) again! J
Cool!!!
If you still did not got the 1.5 version… Just take it to play around with this feature!
Now I’m preparing myself to start adding support to work items basic edition/creation and also to add attachments…
Let’s move on! I keep you updated! J
Posted on 25.06.2011, in Announcements, TFS On The Road. Bookmark the permalink. Leave a comment.

Leave a comment
Comments 0